

Regression is one of the most essential techniques in machine learning, allowing us to model relationships between variables and make predictions. It’s widely used in various fields, from predicting house prices to estimating sales or forecasting weather. While there are many types of regression, each has its unique strengths and applications. This glossary entry will explore the most relevant ones, breaking them down in a clear and approachable way.
Linear Regression
Linear regression is the simplest and most commonly used type of regression. It works by finding the best-fitting straight line through a set of data points, allowing you to predict a continuous outcome based on one or more input variables. For example, you might use it to predict housing prices based on features like square footage or number of bedrooms.
If there’s only one input variable, it’s called simple linear regression. When there are multiple input variables, it becomes multiple linear regression. This technique works well when the relationship between variables is linear, meaning that as one variable increases or decreases, the other does so proportionally. However, it struggles with more complex patterns or non-linear relationships.
Logistic Regression
Despite its name, logistic regression is not used for predicting continuous values but rather for classification tasks. It’s particularly useful when you need to determine whether something belongs to one of two categories—such as whether an email is spam or not, or whether a patient has a certain disease.
Instead of predicting a number directly, logistic regression calculates the probability that an observation belongs to a specific category. For example, it might predict that an email has a 90% chance of being spam. These probabilities are then converted into binary outcomes (e.g., spam or not spam) using a threshold. The strength of logistic regression lies in its simplicity and effectiveness for binary classification problems.
Polynomial Regression
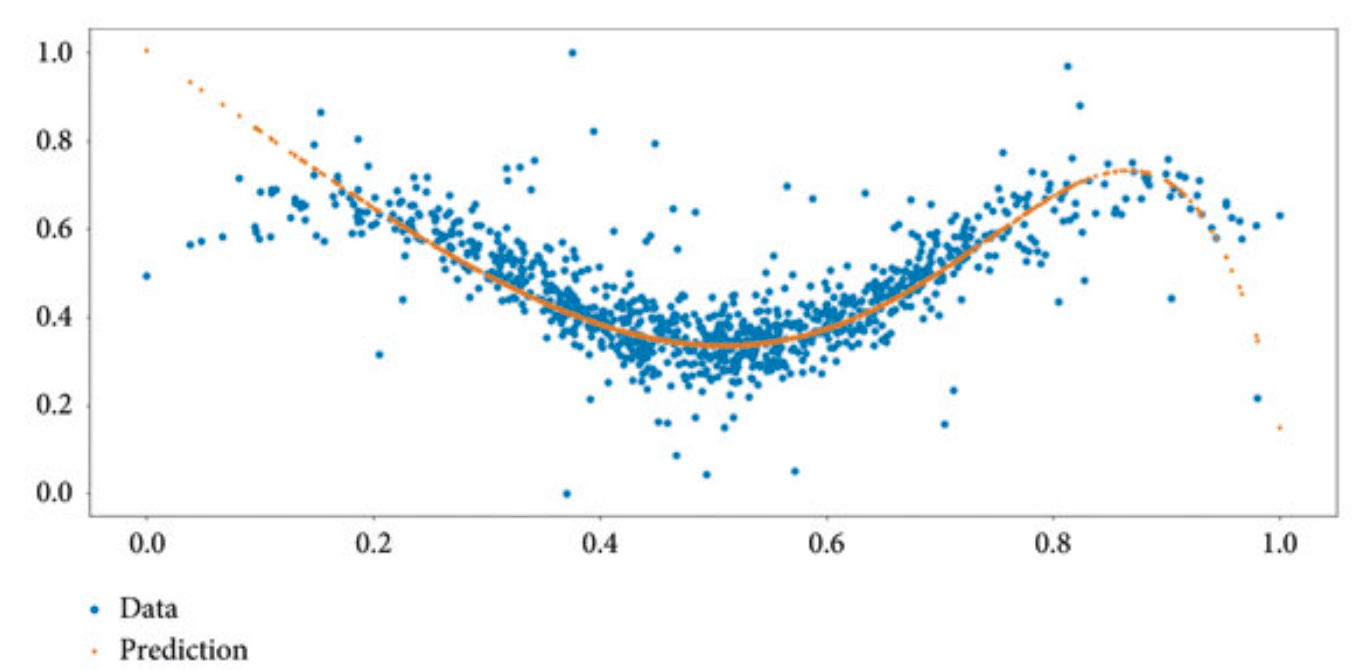
Sometimes, data doesn’t follow a straight-line pattern. In such cases, polynomial regression can be used to capture more complex relationships by fitting a curve instead of a straight line. For instance, if you’re modeling how temperature affects ice cream sales, the relationship might not be linear—sales might increase sharply at first as temperatures rise but level off after reaching a certain point.
Polynomial regression achieves this by adding higher-degree terms (like squares or cubes) to the model. While this makes it more flexible than linear regression, it also comes with risks: if you add too many terms, the model may overfit the data, capturing noise rather than meaningful trends.
Ridge Regression
Linear regression can run into problems when your dataset has many features that are highly correlated with each other (a situation known as multicollinearity). This can make predictions unstable and less reliable. Ridge regression addresses this issue by adding a regularization term—a kind of penalty for overly large coefficients—to the model.
By discouraging large coefficients, ridge regression reduces overfitting and improves the model’s ability to generalize to new data. It’s especially useful when working with datasets that have many features or when some features are highly correlated.
Lasso Regression
Lasso regression is similar to ridge regression in that it adds a penalty to prevent overfitting. However, while ridge regression penalizes large coefficients by shrinking them toward zero, lasso regression can shrink some coefficients all the way to zero. This means lasso not only reduces overfitting but also performs feature selection by effectively removing irrelevant variables from the model.
This makes lasso particularly useful when dealing with high-dimensional datasets where many features may be redundant or irrelevant. By focusing only on the most important features, lasso creates simpler and more interpretable models.
Support Vector Regression (SVR)
Support Vector Regression (SVR) is an extension of support vector machines (SVMs), which are typically used for classification tasks. Instead of classifying data into categories, SVR predicts continuous values while maintaining certain margins of error around the true data points.
What makes SVR unique is its ability to handle both linear and non-linear relationships using kernel functions—mathematical transformations that map data into higher dimensions where patterns become easier to identify. SVR is particularly effective for complex datasets and is robust against outliers, making it a versatile choice for many real-world problems.
Decision Tree Regression
Decision tree regression provides a completely different approach compared to traditional methods like linear regression. Instead of fitting equations to data points, it splits the dataset into smaller subsets based on feature values. Each split creates branches in a tree-like structure until predictions are made at the leaves.
This method is highly intuitive and easy to visualize—making it popular for understanding how decisions are made in complex systems. Additionally, decision trees can handle non-linear relationships well without requiring extensive preprocessing of data. However, they can overfit if not properly pruned or combined with ensemble methods like random forests.
Bayesian Linear Regression
Bayesian linear regression takes traditional linear regression one step further by incorporating principles from Bayesian statistics. Instead of treating model parameters as fixed values, Bayesian methods assign them probability distributions based on prior knowledge and observed data.
This approach provides more flexibility and allows for uncertainty in predictions—something that’s particularly useful when working with small datasets or when prior knowledge about the problem domain exists. Bayesian models also offer probabilistic interpretations of predictions, giving you confidence intervals rather than single-point estimates.
Choosing the Right Regression Method
Selecting the appropriate regression method depends on understanding your ML system’s characteristics, requirements, and constraints. Consider the size and structure of your monitoring data, the complexity of relationships between ML metrics, and the importance of interpretability in your results. The computational resources available and the need for real-time predictions may also influence your choice.
The nature of your prediction task plays a crucial role in method selection. Linear regression might suffice for simple relationships like dataset size vs. training time, while polynomial regression or SVR might better handle complex patterns in model performance analysis. If you have many potential ML metrics, Lasso or Elastic Net might prove more appropriate for identifying the most important factors.

